Experiments

Core Concepts
Basic Concept
An Experiment in HoloBit is a systematic process of running a pre-existing simulation model with selected algorithms and configurations to collect and analyze results. It allows researchers to test hypotheses, explore parameter spaces, and observe emergent behaviors.
Experiment Scenarios
- An Experiment Scenario is a specialized type of Holo File scenarios.
- Every Experiment Scenario must reference an existing Model Scenario as its foundational context.
Experiment vs. Model Scenarios
The relationship between Model Scenarios and Experiment Scenarios follows these rules:
| Rule | Description |
|---|---|
| 1 Model Scenario → N Experiment Scenarios | A single Model Scenario can be reused as the foundation for multiple, distinct Experiment Scenarios. |
| 1 Experiment Scenario → 1 Model Scenario | Each Experiment Scenario is exclusively linked to one specific Model Scenario. |
| Setup Requirement | Before you can create an Experiment Scenario, you must first select or define the target Model Scenario. |
Throughout this documentation, "Model Scenario" and "Experiment Scenario" refer to specific scenarios within a .holo file. They should not be confused with the more abstract, general concepts of a "model" or an "experiment."
Configuration, Execution, and Records
HoloBit experiments provide a flexible and powerful environment for exploring your models.
Customizable Dashboards
HoloBit experiments are designed for high flexibility and complete customization. You're not limited to just selecting experiment types and configuring algorithms; you can also freely design and lay out input and output Cards on an interactive Dashboard by dragging and dropping widgets – without coding.
With this dashboard, you can:
- Add Panel Cards: To interactively adjust the initial values of your model's parameters before or between runs.
- Add Chart Cards: To visualize experiment results in real-time or post-simulation, making it easier to understand trends and patterns.
Edit Mode vs. Use Mode
The experiment dashboard operates in two distinct modes:
| Mode | Primary Purpose |
|---|---|
| Edit Mode | Design the experiment: Build or modify Panel Cards and Chart Cards, and configure their layout and properties. |
| Use Mode | Run the experiment: After exiting Edit Mode, tune parameters using the configured Cards, execute runs, and observe results. |
Default Values & Runtime Values
Understanding how values are handled is important:
- Default Value: This is the value set for a card's widget while in Edit Mode. Default Values are saved as part of the Experiment Scenario.
- Runtime Value: This is the value a card's widget is set to (potentially adjusted from the Default Value) when you are in Use Mode. This value is applied for the current experiment run and is logged in the experiment record for that run.
- Independence of Values: Adjusting a Runtime Value during an experiment run does not overwrite the Default Value. If you return to Edit Mode, the Panel Cards will display their original Default Values.
Execution Workflow
Running an experiment in HoloBit follows a clear sequence:
- Initialization: The model's initial state and parameters are set according to the Experiment Scenario's configuration. Any variables not explicitly configured in the experiment will inherit their values from the base Model Scenario.
- Execution & Iteration: The chosen algorithm engine runs the simulation model iteratively, adhering to user-defined settings, and continuously stores the resulting data.
- Result Logging: All relevant experiment results and specified data points are systematically saved to a data table.
- Chart Display: Chart Cards, as configured on the Dashboard, automatically read data from this data table to render visualizations of the experiment's progress and outcomes.
Experiments do not modify the structure or state of your original Model Scenario, ensuring safe testing.
Computational Cost
The cost of running HoloBit experiments varies based on the chosen execution environment:
| Execution Environment | Cost | Details |
|---|---|---|
| Client-side | Free (unlimited usage) | — |
| Cloud-side | Consumes Subscription Quota | Refer to the subscription details and pricing page for more information. |
Run Records
HoloBit automatically tracks every experiment run and stores it as a run record.
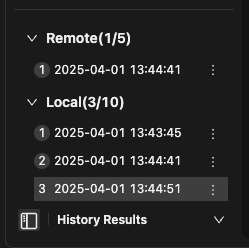
- Record Generation: After each successful experiment run, HoloBit automatically creates a run record. This record captures the runtime values from the Panel Cards for that run, along with the data displayed on the Chart Cards.
- Local Storage: Records are saved locally and roll over (newest replaces oldest) when the storage limit is met. Manual cleanup is typically not required for these local, unsaved records.
- Manual Management: To protect or manage key records, you can Lock (prevents local rollover), Upload (to cloud), and Download (from cloud).
- Reproducibility: If the dashboard structure remains unchanged since a record was saved, loading that record will fully restore parameter settings and results. Any dashboard modifications made afterward (such as adding/removing cards or adjusting data mappings) may result in partial restoration.
Important Notes on Records
- Records are Immutable: When you load an existing run record, any adjustments you make to Panel Card settings are for temporary exploration. These changes will not be saved back to the loaded record, preserving its integrity.
- Charts Redraw, Data Remains Unchanged: If you load a record and then enter a chart's editing interface to modify how data is plotted (e.g., changing chart type or axes), this only affects the current visualization. The underlying result data within the loaded record remains unaltered.
- Locking and Saving Behavior:
- Locking local records prevents them from being automatically overwritten. If all local record slots are filled and all existing records are locked, you can still run new experiments, but the results of these new runs will not be saved as there are no available slots to write to.
- If the local record quota is met but there are still unlocked records, the system will follow the rolling storage mechanism: the newest experiment result will overwrite the oldest unlocked record.
Interface Overview
The HoloBit experiment interface is designed for clarity and efficient workflow. Key areas are numbered:
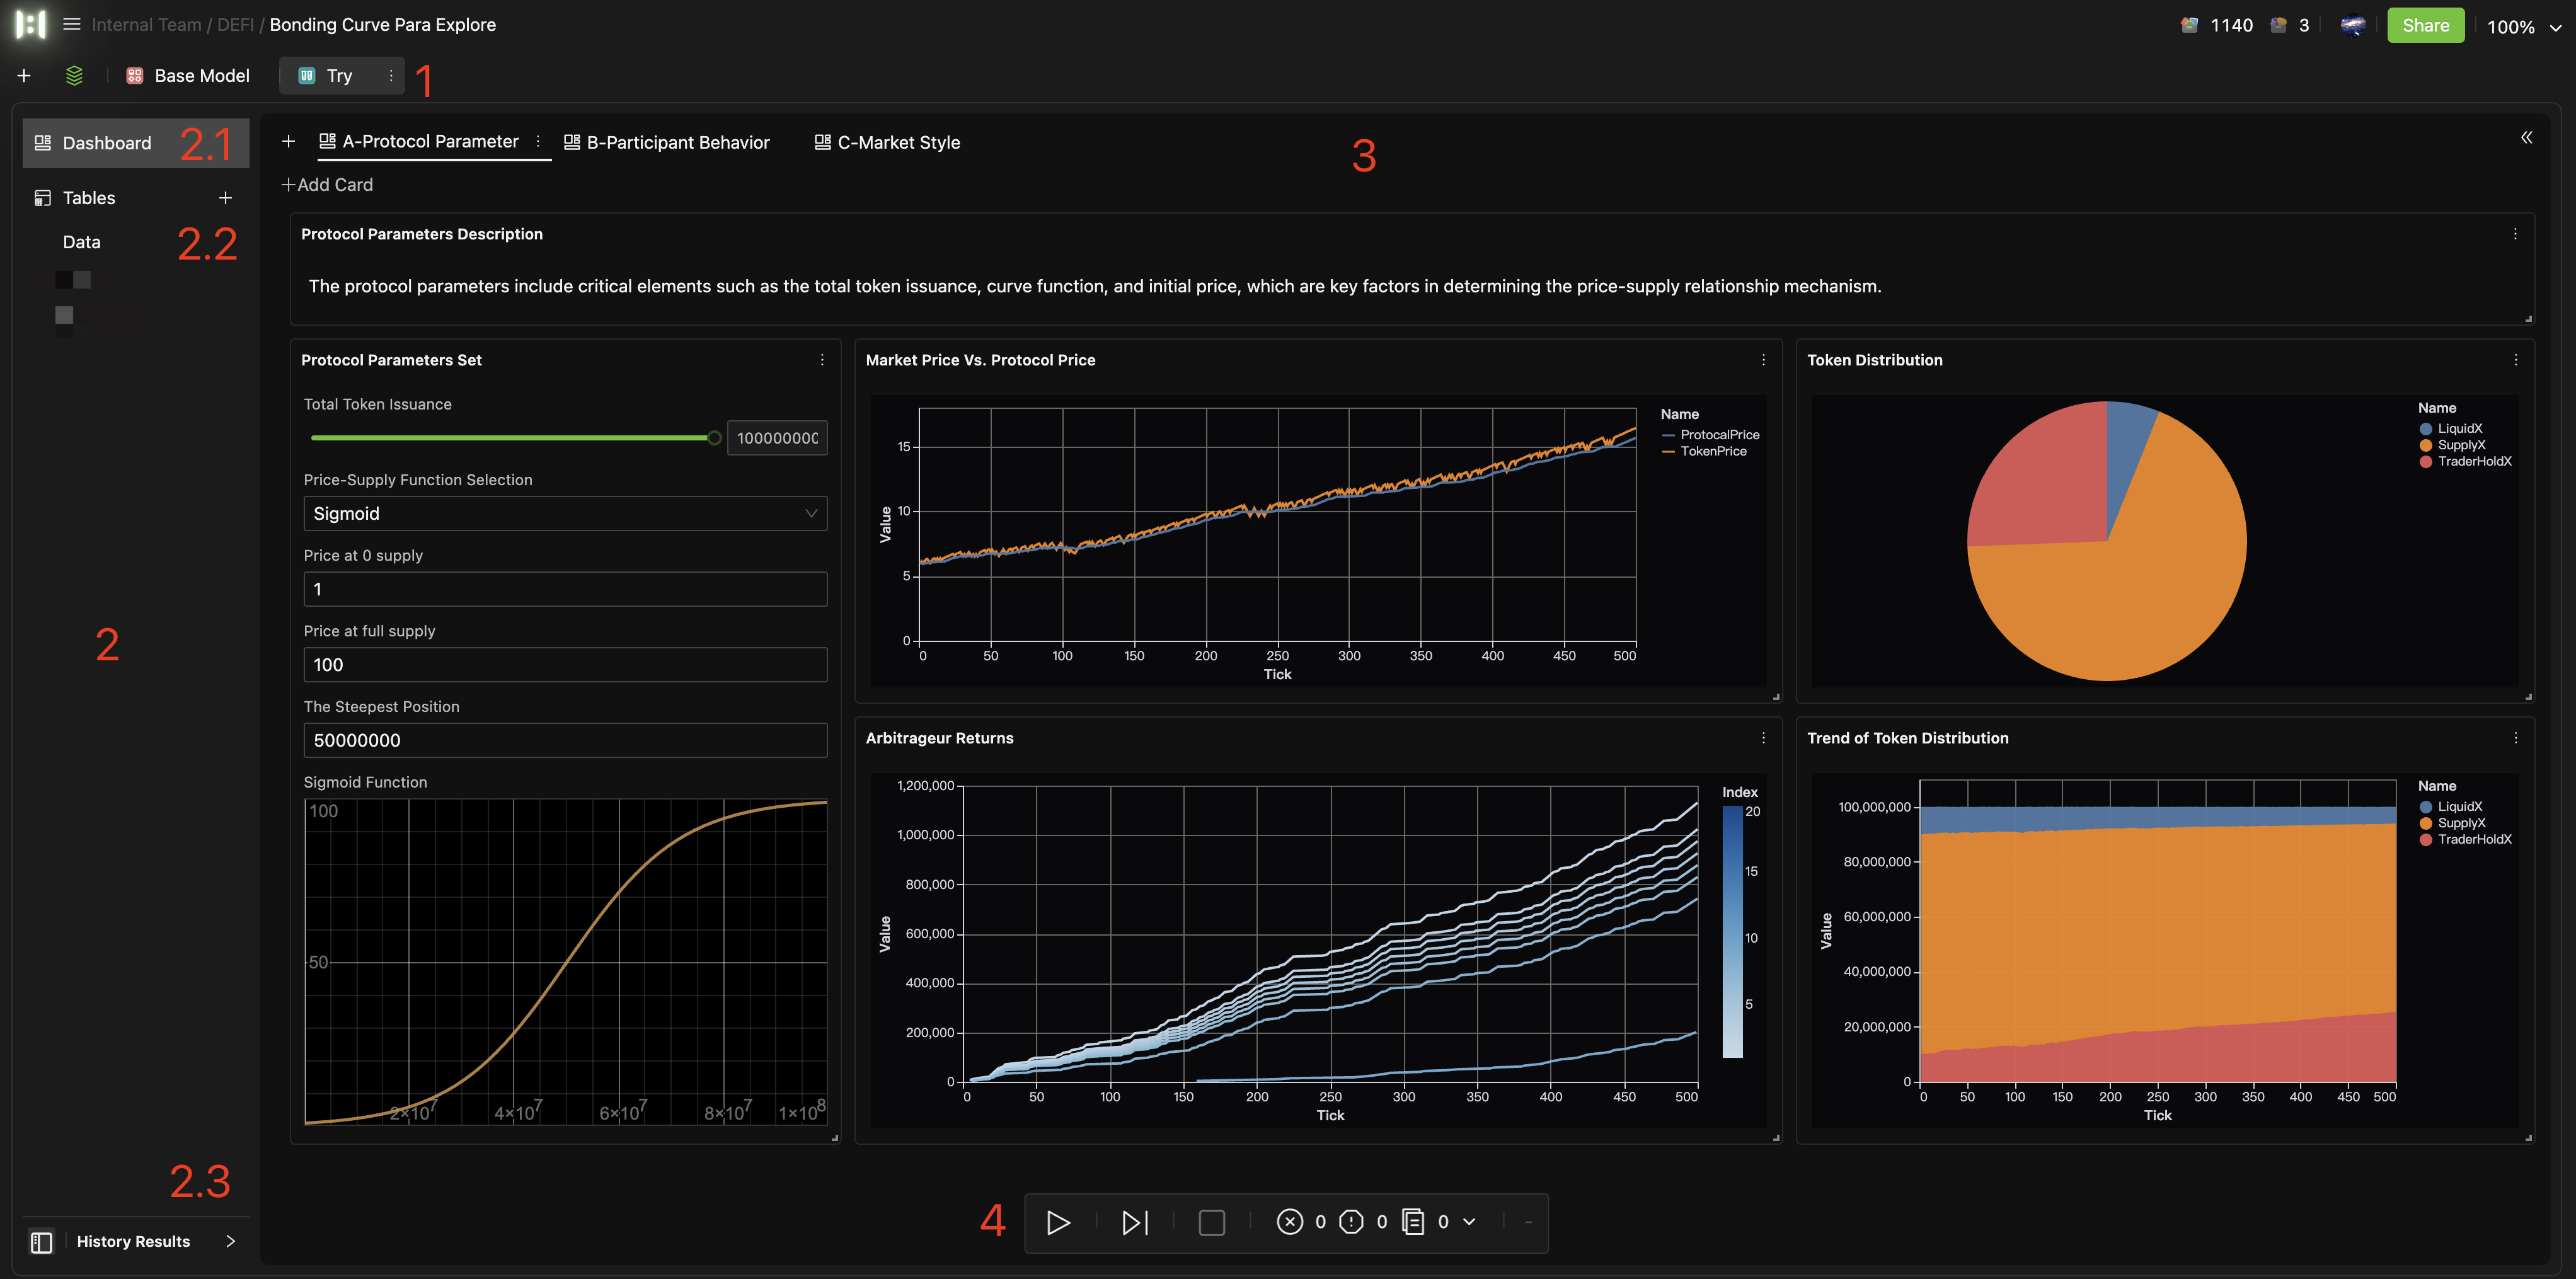
- Title Bar: Displays the name of the current Experiment Scenario (e.g., "Bonding Curve Para Explore" as shown in the image).
- Sidebar: Provides access to different sections of the experiment environment:
- 2.1 Dashboard: The main interactive area for configuring parameters, adding charts, and viewing experiment progress.
- 2.2 Tables:
- Data: Access and view the raw data generated by your experiment runs.
- Other data resources, if any.
- 2.3 Run History: Manage and review past experiment runs.
- Main Working Area: This is the central canvas where you build your experiment interface by adding and arranging Panel and Chart Cards. It's also where you observe the visual outputs of your experiment.
- Run Control Bar: Controls to start, pause, or stop experiments.
Basic Operations
This section covers the fundamental operations for working with experiments.
Creating an Experiment
-
There are a couple of ways to initiate a new experiment:
- Method 1: Navigate to File Scenario Management (within your model file), and add a New Experiment scenario.
- Method 2: Locate the target Model Scenario. From its management menu (often a kebab/three-dot icon
⋮), select New Experiment.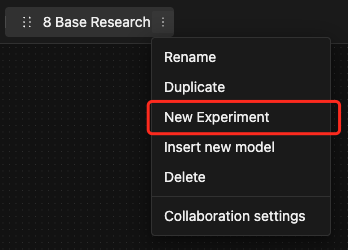
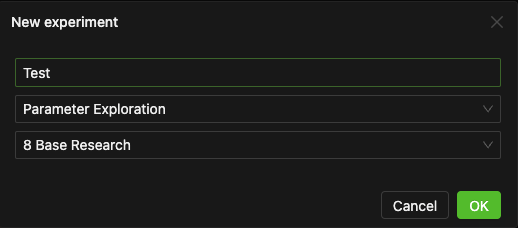
-
Once you initiate creation, enter the experiment name, select experiment type and target model scenario (this field will be pre-filled if you used Method 2) in the creation dialog, then confirm.
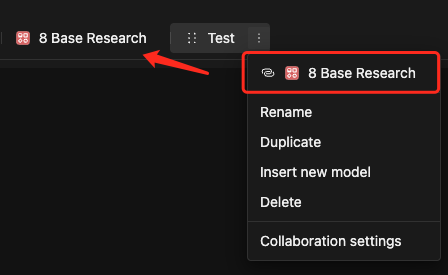
Managing Experiment Scenarios
For existing Experiment Scenarios, you can typically perform actions such as:
-
Navigate to Model Scenario: Quickly open or jump to the underlying Model Scenario that the experiment is based on.
-
Rename
-
Duplicate
-
Insert new model
-
Delete
-
Collaboration settings
Configuring an Experiment
Once you are within an Experiment Scenario (having already selected a target Model Scenario and experiment type), all subsequent configuration steps are performed within the Dashboard working area.
To construct your experiment, you'll typically follow these three configuration steps:
-
Algorithm Setup: Open the global panel → Navigate to the built-in algorithms → Choose and configure the appropriate one for your experiment
Tip- This step is usually essential for most experiment types, except for very basic manual "Parameter Exploration" where you might just be changing values and observing.
- Available experiment types depend on your subscription plan. For details, check the Personal Center.
-
Set Initial Parameter Values (Panel Cards): Click + Add Card button → Select Panel → Edit the required widgets to set the initial/default values for target model parameters.
-
Define Output Charts (Chart Cards): Click + Add Card button → Select Chart → Configure the chart to visualize experiment results.
TipYou can then drag and drop these Panel and Chart Cards to arrange their layout on the Dashboard for intuitive access and during an experiment.
Running an Experiment
Once your experiment is configured:
- Use the Run Control Bar (item 4 in the Basic Interface overview) to:
- Start the experiment.
- Pause an ongoing experiment.
- Stop the experiment.
- Review runtime logs in the Console.
Managing Run Records
After running experiments, you can manage the automatically generated records.
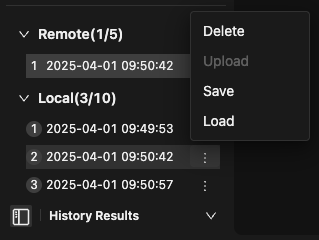
For local records, you can:
- Upload to Remote: Transfer a selected local record to cloud storage. This is useful for backing up important results or sharing them with team members.
- Pin: Protect a specific local record from being automatically overwritten by the default rolling storage mechanism. This ensures critical local results are preserved until explicitly deleted.
- Load Record: Open a selected historical record. This will typically restore the panel Card settings and attempt to reproduce the chart visualizations from that run. Double-clicking a record often performs the same action.
- Delete: Permanently remove unwanted records to free up space.
For remote records, you can:
- Download: Save a record stored in the cloud to your local machine.
- Delete: Permanently remove unwanted records to free up space.
The amount of storage available for your run records, either local or remote, is typically tied to your HoloBit subscription plan. If you reach your storage limit, you may need to upgrade your subscription or delete older/unnecessary records to free up storage space.