Model Debugging
Console
One of the keys to debugging models is proficient use of the Console.
Function
The Console allows you to view system information and utilize debugging tools.
Basic Usage
-
View Information
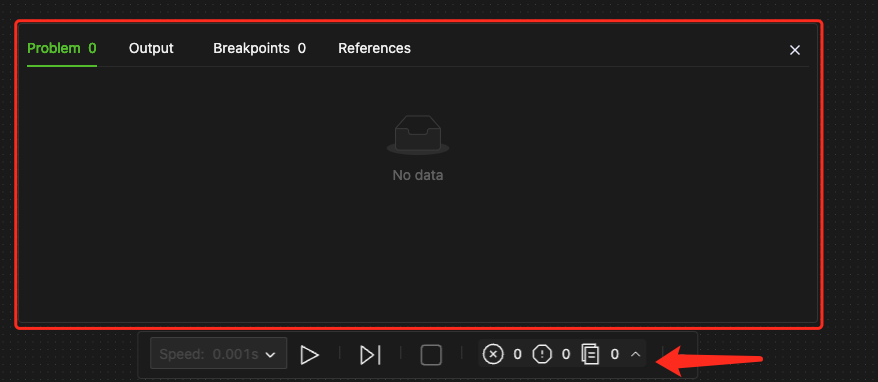
Click on the warning or error on the run control bar to open the console. Alternatively, the console may automatically appear during certain operations, such as searching for variable references or when simulation errors occur.
-
Display Information
The system prompt information is categorized and displayed in tabs as shown in the picture above. The following sections provide a guide on how to navigate and utilize this information.
-
Locate and Navigate
By clicking on the highlighted symbol or the name of an object in the information pop-up window, you can directly navigate to and focus on that particular object.
Problem
Running Errors
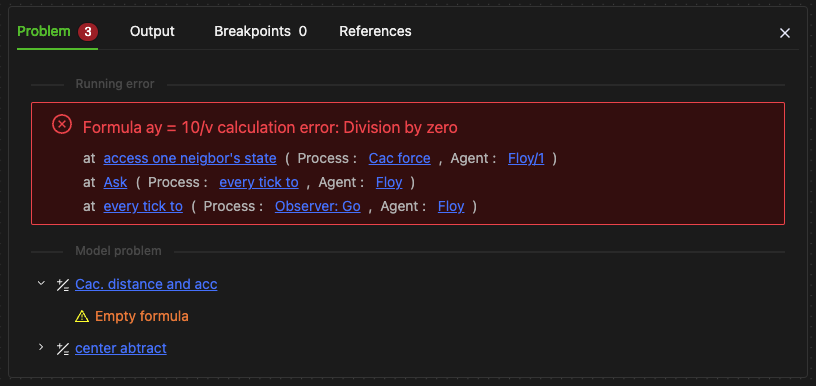
- As shown in the red zone in the image above, an error symbol in red "X" appears at the top of the window.
- Running errors only occur during model runs and will cause the run to stop.
- They are presented in an "error content - error location" format.
- Error Stack Information
- Below the running errors, which are highlighted in red, you'll find the call stack information. This begins with "at."
- When an error object is called multiple times, each line represents one layer of calls, shown from top to bottom.
- Each line is displayed in the format
Object Name (Process, ``Agent``). - Multiple lines, from top to bottom, represent higher-level callers in sequence.
Running error: A division by zero error has occurred in the calculation formula for ay.
- The error location is in the
access one neighbor's statecomponent (This component is in theCac Forceprocess and belongs to theFloy1individual). - The Ask component calls the aforementioned
Cac Forceprocess (Ask is in theevery tick toprocess and belongs to theFloypopulation observer). - The
every tick toprocess (which is in theObserver:Goprocess and belongs to theFloypopulation observer).
Model problems
- The
Cac. distance and acccomponent has the following issues: - Undefined empty formula
- ...
You can click on the highlighted sections within the quotes in the above image to navigate to the corresponding location.
Model Problems
-
These problems can arise during any stage of the modeling running and are presented in a "problem object-error content" format across multiple lines.
-
Model Warnings
These warnings will not stop the simulation from starting or running and are displayed with a ⚠️ symbol, such as the "Empty formula" warning shown in the figure above.
-
Model Errors
These will prevent the simulation from starting and are displayed with an "X" symbol, as shown in the figure below.
- Running errors must be resolved correctly before the simulation can run.
- Model problems may stop the model from running. They must be resolved correctly before starting the simulation.
- While Model warnings do not stop the model from running, they do point out potential issues with the model's logic. Such problems could involve unintentional name collision of variables, leading to incorrect object reads. Thus, it's recommended that these warnings be addressed and rectified promptly.
Output
-
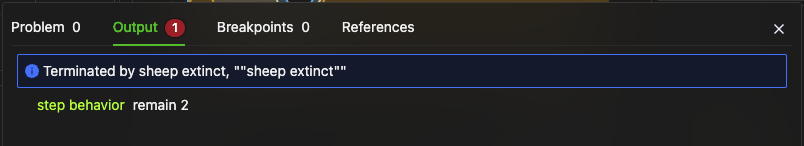
User-customized print messages
As seen in the first line of the image, the message "sheep extinct" is output after the terminate event in the model is triggered.
-
Remaining Triggers after simulation completion
As shown in the second line of the image, "
step behaviorremain 2" means that 2 Triggers remain in thestep behaviorprocess.
Breakpoints
Basics
-
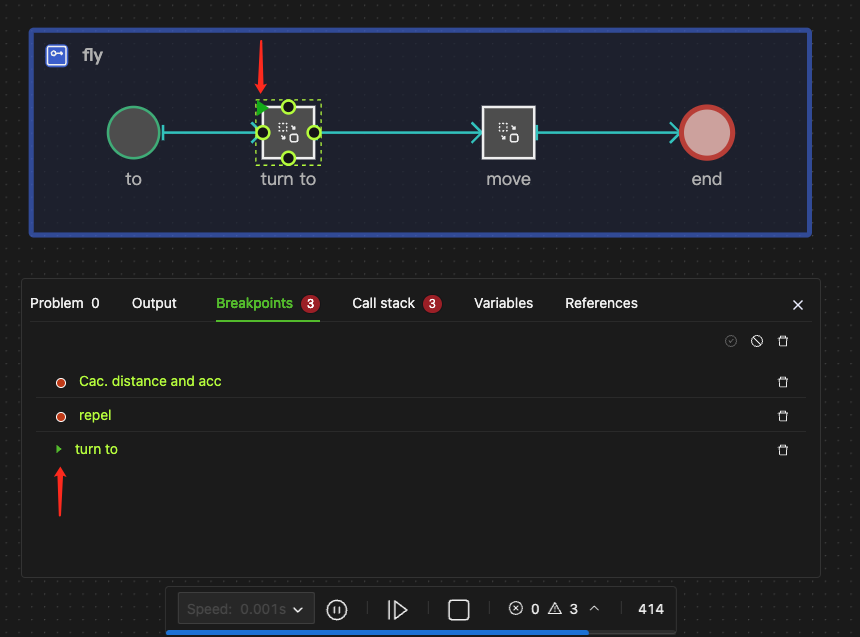
Display
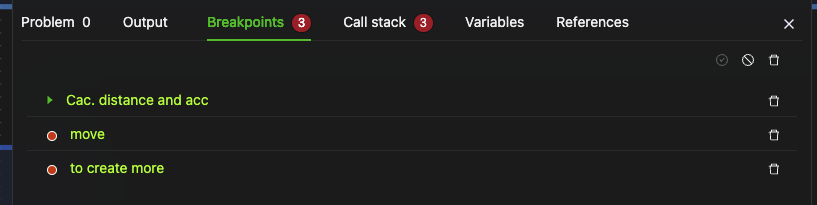
All debug breakpoints set in the model are displayed. Each line represents one breakpoint. If there are multiple breakpoints, they will be displayed on separate lines.
-
Operations
Control buttons are located on the right side of each line, allowing operations such as Enable, Disable, and Remove.
- The model stops at the first breakpoint (Cac. Distance and acc), as shown in the image above.
- The two breakpoints marked with red dots below indicate they are enabled but not triggered yet.
Call stack for Breakpoints
-
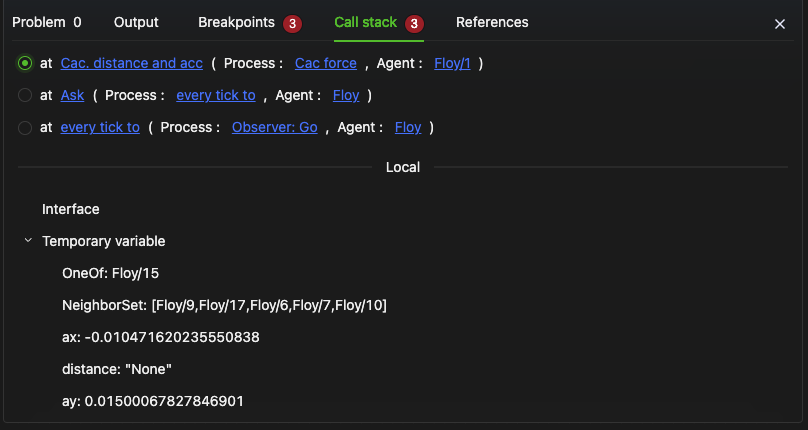
When a breakpoint is triggered (as shown in the first breakpoint in the image), a call stack information tab appears, indicating the hierarchical information of the calls at that breakpoint.
-
By clicking this tab, you can access the multi-level information, referred to as Call Stack information, associated with that breakpoint location. The figure below illustrates this.
-
The method for reading and using the stack is the same as explained in the Running Errors.
Local Variables
- Below the call stack, you'll find a display of current values for all local variables in the process of the selected stack. This includes both interface and temporary variables.
- To view local variables at different levels of the call stack, use the radio buttons located to the left of each "at" statement. The local variable information will update to reflect the selected stack level.
- Clicking on any local variable in this display will take you to focus the canvas view on that variable and select the variable in the canvas view. This feature allows for quick navigation and inspection of specific variables within their context in the model.
References
Function
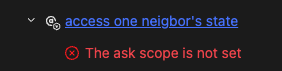
- Display all expressions and formulas in the model that reference a specific data object.
- Show all calls or ask-to-calls to a specified process in the model.
Finding References to Data Objects
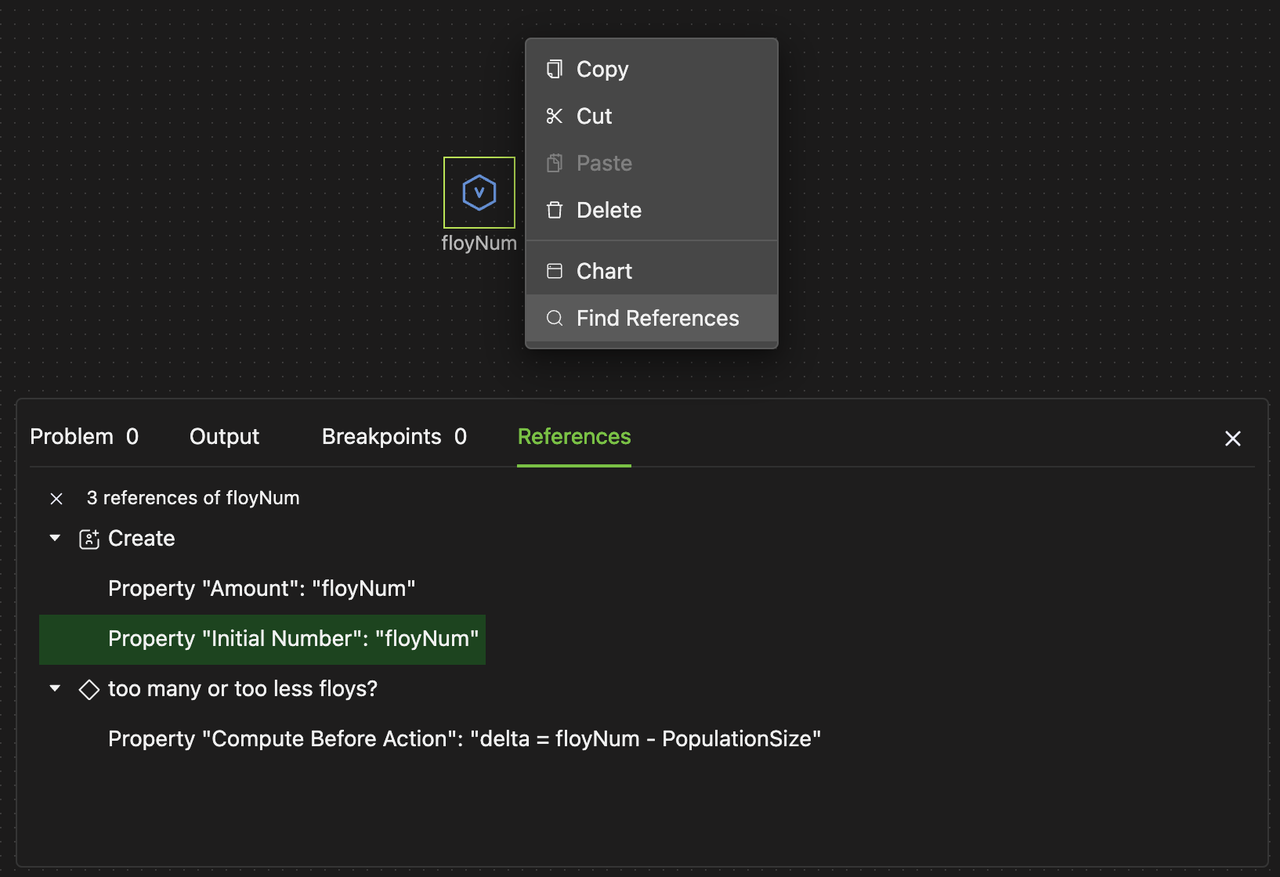
- Right-click on the target object and select "Find References" from the pop-up menu. This will automatically open the Console's "References" tab.
- A list of all component objects containing formulas or expressions that use the selected variable will be shown. Click on any listed item to jump to and focus on that object in the model.
- Example: Let's say you discover a global variable in an unusual state, and this variable is altered in various parts of the model that each requires individual inspection. In this situation, you can use the 'References' feature to swiftly navigate through all the related formula locations in order to look for potential errors. Additionally, in the model object tree, you can search for locations on the canvas where this variable is linked to process ports, as these connections might also alter its value.
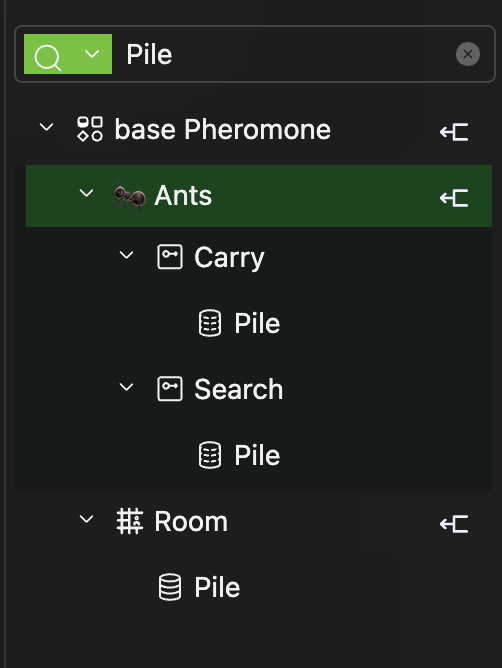
- Note: The values of data components can be modified or read not only within formulas or expressions but also in the graphical modeling itself. For example, State Connectors can pass the variable to the output ports, Container Operate components, and more. In these situations, you can use the model object tree's search bar to find related locations, as shown below.
- Summary: When you need to find all references of a particular data object in modeling, use the 'References' tab in the Console. This will help you find related formulas or expressions. Additionally, you can also use the search box in the Model Object Tree to find objects and their references within the canvas.
Finding Process Calls
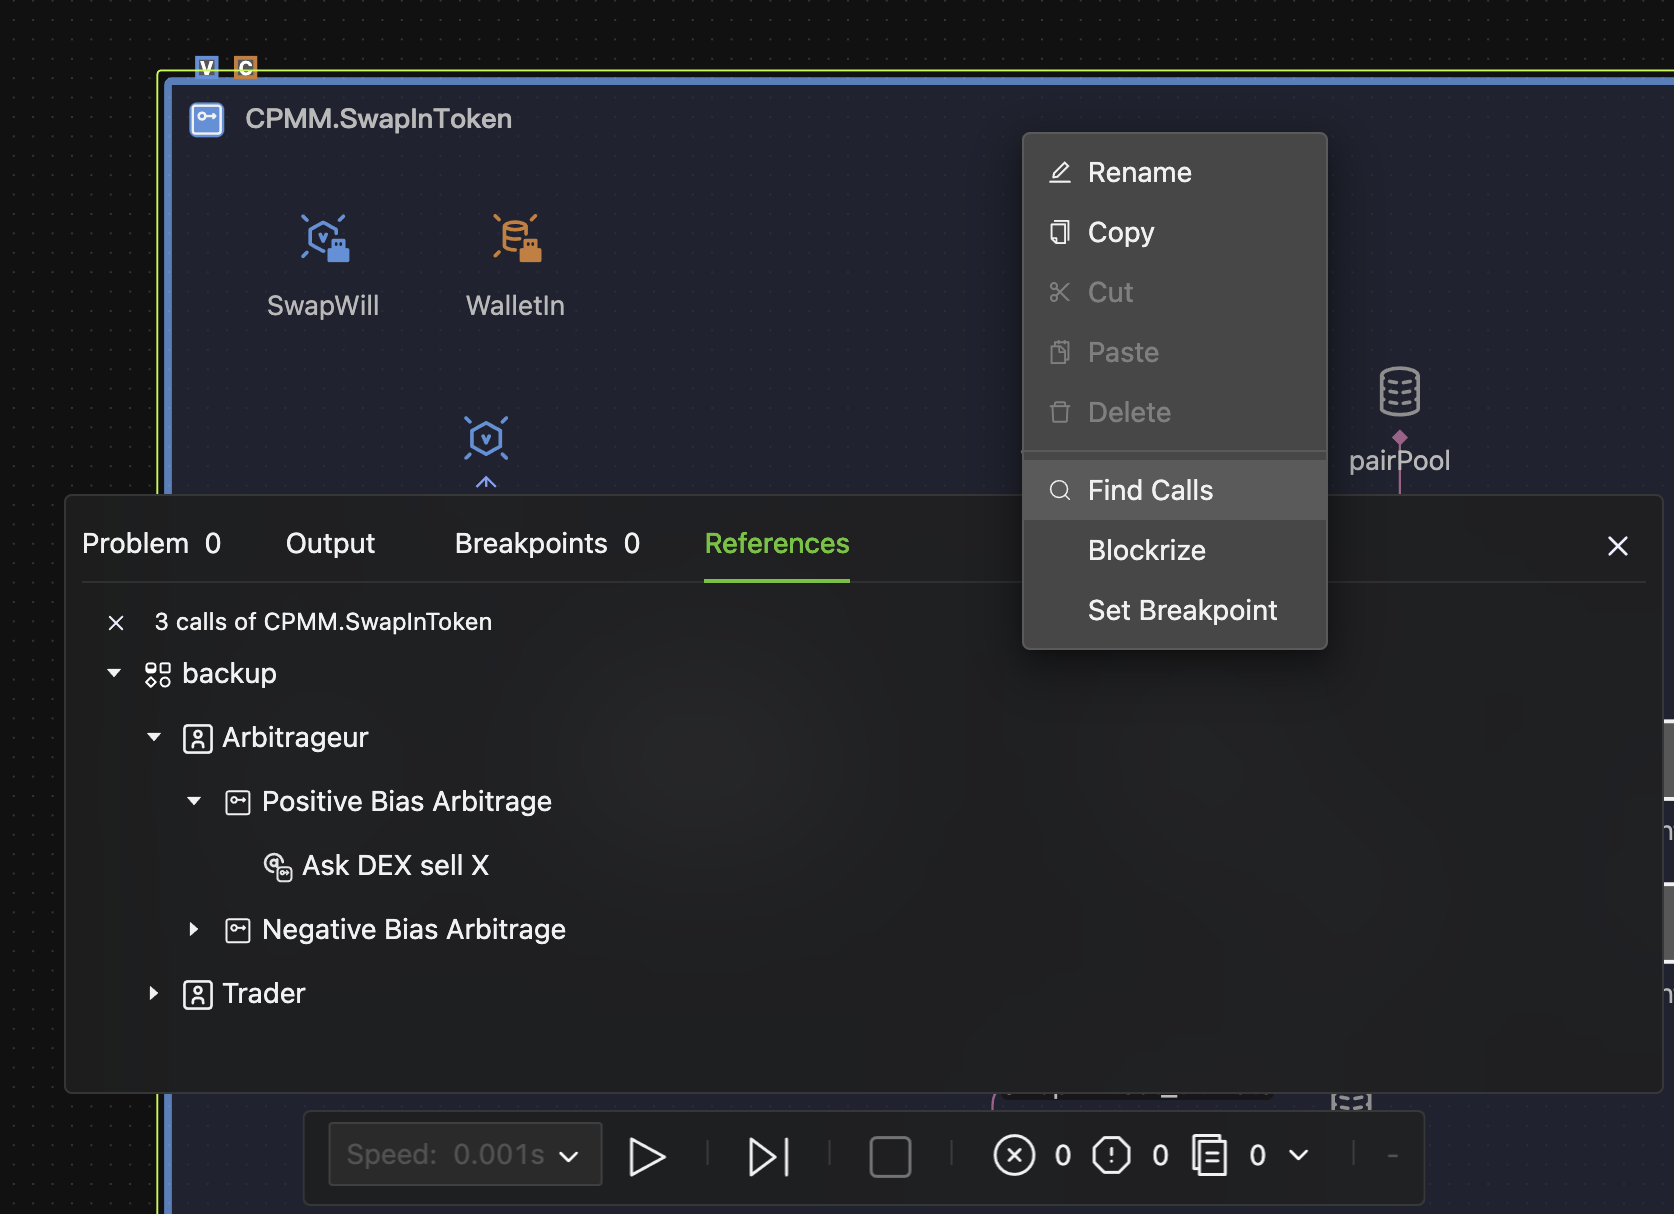
- Right-click on the target process object and select "Find Calls" from the pop-up menu. The Console will open, showing the "References" tab.
- A list of all objects that call or ask to call the current process will be shown. Click on any listed item to jump to and focus on that object in the model.
Finding references and calls supports querying from both the original data object or process (via the right-click menu) and any quoted or called object. This feature allows you to find all references and calls of a specific object, providing comprehensive search capabilities throughout the model.
Debugging with Breakpoints
Function
Breakpoints, when set on process components, cause the simulation run to pause when the Trigger flow arrives, thus preserving the current state. It can then be used for debugging.
How to use
-
Set Object
Breakpoints are typically set on process components.
-
Working Mechanism
When the model runs and the trigger reaches the breakpoint, the simulation will pause (The component where the breakpoint is set is not triggered at this moment.) and allow you to check the system state.
-
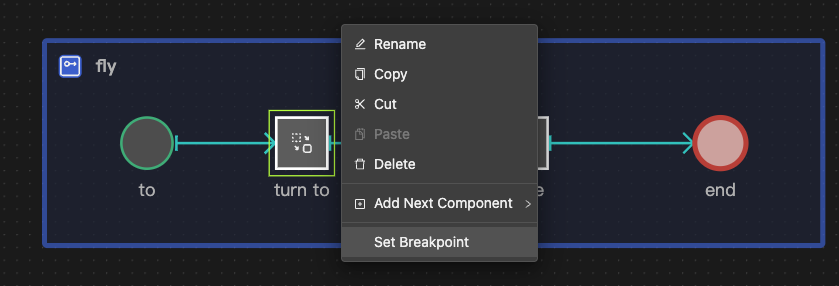
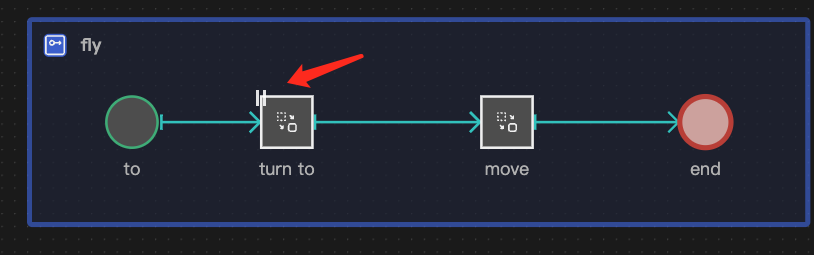
Set Breakpoint
Right-click the process step object and select Set Breakpoint from the menu. This action will cause the simulation to pause before the selected object is triggered.
-
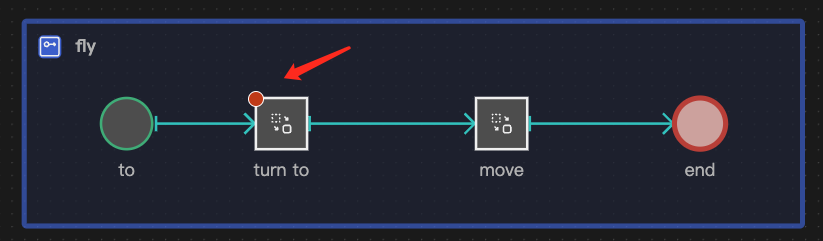
Display
Once set, a red dot appears in the upper left corner of the object. This represents a breakpoint. When the simulation reaches this point, the system pauses, and a pause button flashes.
-
View Information
When triggering a breakpoint, click the Breakpoints or Call Stack tabs in the Console to view detailed state information. Here, you can review all breakpoints and the current pause status, run or delete breakpoints as needed, and view the call stack for the current breakpoint, including the state of local variables in the process where the breakpoint is set. For more details, see the previous section on Breakpoints.
-
Continue Running
Hovering over the Pause button will change it to a Run button. Click it to continue running, or click the Run button in the Breakpoints tab of the Console.
-
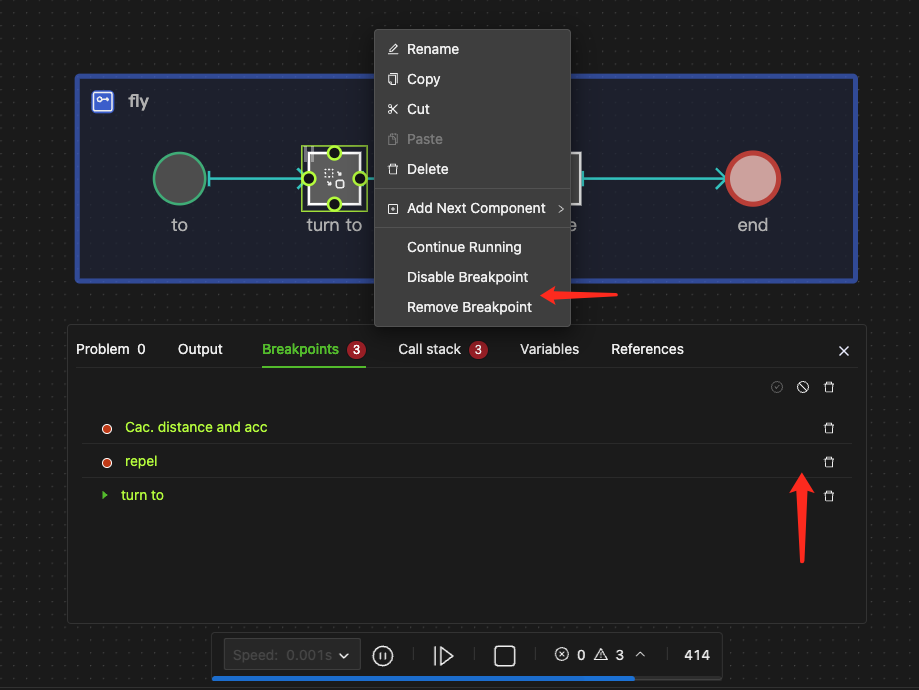
Disable
Right-click the menu and select Disable Breakpoint, or click the Disable button in the Console.
-
Remove
Right-click the menu, select Remove Breakpoint, or click the Remove icon in the Console.
TipIf you delete the breakpoint where the run is currently stopped, the pause button will still flash in the upper left corner of the component object. This is not a malfunction; you need to click the button again to run, and the current breakpoint will disappear.
Example
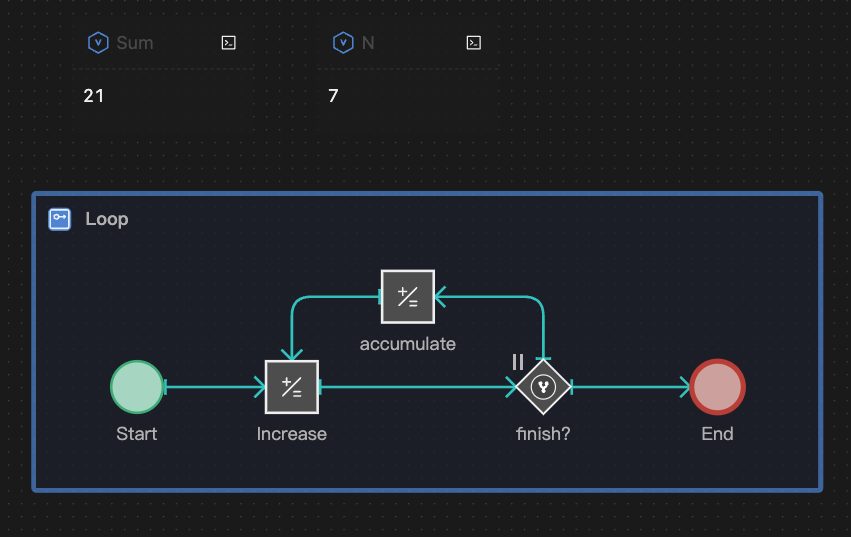
- Consider a
Loopprocess that calculates the sum of numbers from 1 to 100 within one tick. When you run the model, you can only see the final result, theSum, but not the intermediate results. - To solve this, you can set a breakpoint on the gateway. This pauses the model when it reaches this point, enabling you to inspect the intermediate results and observe the outcome of each iteration within the loop, as shown in the image on the right below.