Network Charts
Icon
Function
The network chart dynamically creates a visual representation of the relationships and interactions between different entities. It utilizes Agents as nodes and Links as edges between these nodes.
Key Points
- Plotting Objects: All Link populations and Agent nodes within the model will appear in the network chart.
- Network Chart Styles: The same network relationship can be displayed in various styles. It's important to note that these style settings only impact the visual presentation without changing the logical structure.
- Cells will not appear in the network charts.
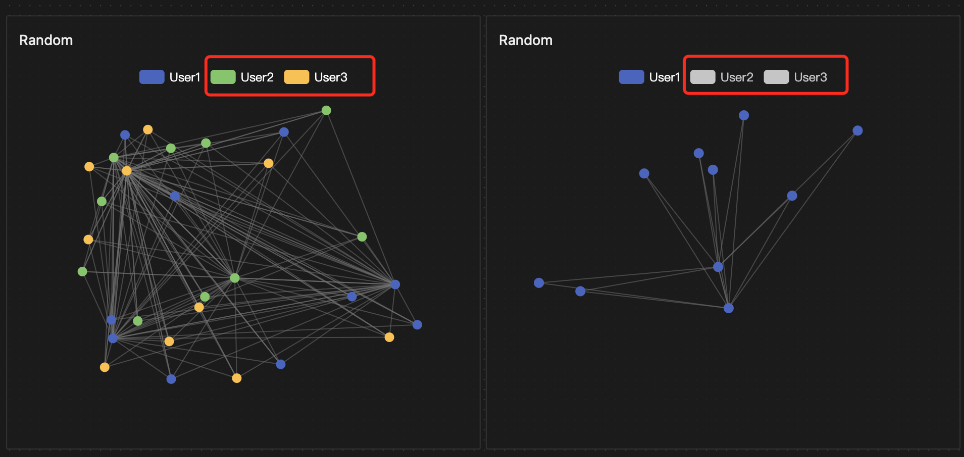
- The network chart allows dynamic toggling of displaying or hiding the Agent populations as network nodes by clicking on the legend.
Setup Methods
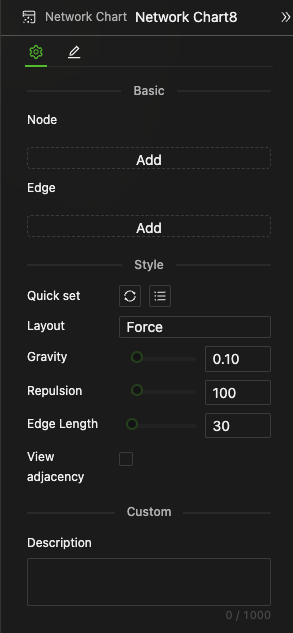
The overall settings include Node and Edge configurations, as well as Style settings.
Nodes
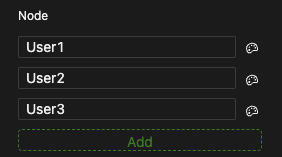
Adding Nodes
- Click the Add button to add new rows, supporting multiple Agent populations.
- Use the dropdown list to select an existing Agent object from the current model.
Setting Node Styles
In most cases, you do not need to set node styles manually. The system supports one-click quick settings for drawing nodes based on default themes or entity properties, with the default being the former. Only customize the appearance if you need bespoke visual styles.
Click the style settings button to the right of the dropdown menu to bring up the settings window:
-
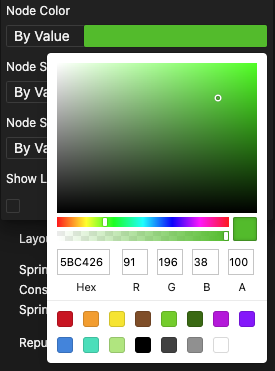
Node Color: Choose from the default/by value/by entity property.
-
By default, the system assigns colors in a series order for multiple Agent populations.
-
By value, the same color is applied to all nodes in the Agent population and can be selected from the color palette.
-
By entity property, the system uses the
Colorproperty value for each node. IfNone, the default color is used.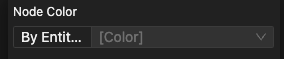
-
-
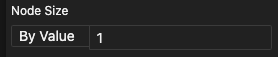
Node Size: Choose from specified value/entity property.
-
By value, the same size is applied to all nodes in the Agent population, with a default of 1.
-
By entity property, the system uses the
Sizeproperty value for each node. IfNone, the default size of 1 is used.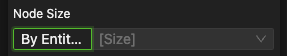
-
-
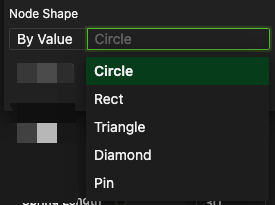
Node Shape: Choose from specified value/entity property.
-
By value, the same shape is applied to all nodes in the Agent population, with the default being a Circle.
-
By entity property, the system uses the
Shapeproperty value for each node. IfNone, the default shape is Circle.
-
-
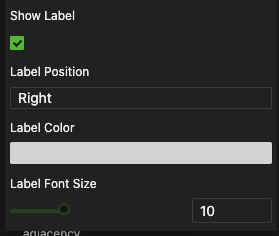
Show Label: When the option to display labels is selected, the network immediately shows labels for each node, providing information about these Agent individuals.
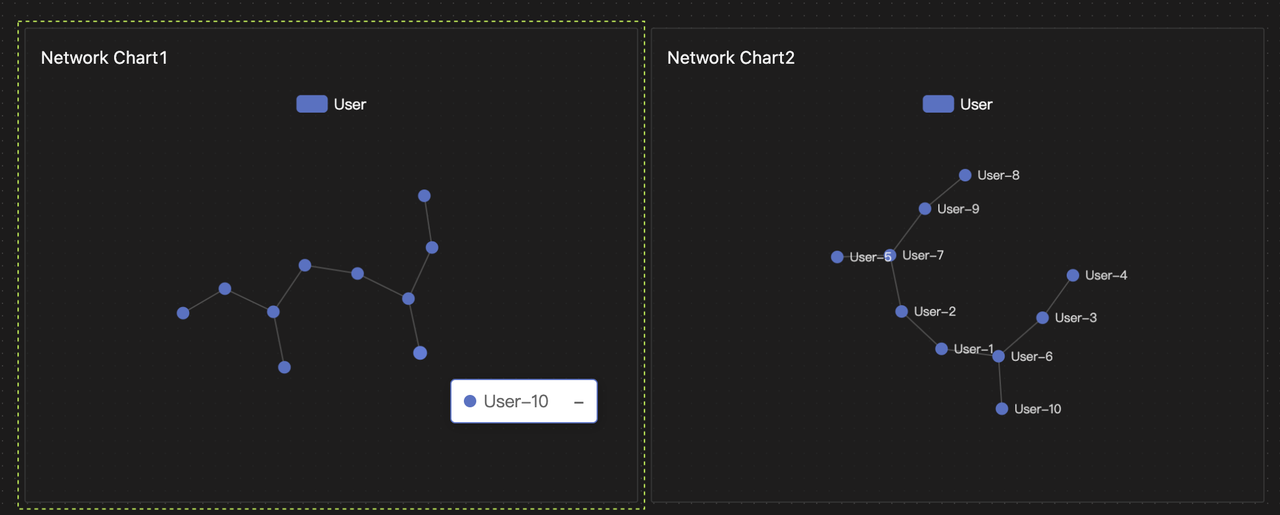
When hovering the mouse over nodes or edges in the chart, a tooltip will appear displaying information about the respective node or edge, as shown in the left image above.
-
Additional settings for label position, color, and font size will appear below for further customization.
Edges
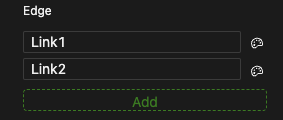
Adding Edges
- Click the Add button to add new rows that support multiple Link populations.
- Use the dropdown list to select an existing Link object from the current model.
Setting Edge Styles
In most cases, you do not need to set edge styles manually. The system supports one-click quick settings for drawing nodes based on default themes or entity properties, with the default being the former. Only customize the appearance if you need bespoke visual styles.
Click the style settings button to the right of the dropdown menu to bring up the settings window:
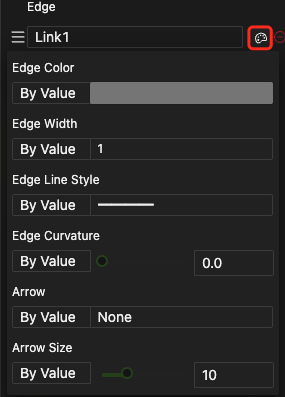
-
Edge Color: Choose from by value/entity property/start node/end node.
-
By value, the same color is applied to all edges in the Link population, with a default of gray. Users can select from the color palette. This helps you achieve personalized settings for the population.
-
By entity property, the system uses the
Colorproperty value for each Link. IfNone, the default color is used. This helps you achieve personalized settings for individuals.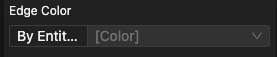
-
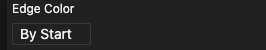
By start node, the link color matches the color of the start node's Agent. This helps you achieve personalized settings for Agent individuals.
-
By end node, the Link color matches the color of the end node's Agent.
-
-
Edge Width: Choose from by value/entity property.
-
By value, the same width is applied to all edges in the Link population. This helps you achieve personalized settings for the population.
-
By entity property, the system uses the
Thicknessproperty value for each Link. IfNone, the default value is 1. This helps you achieve personalized settings for individuals.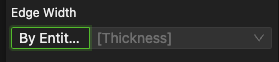
-
-
Edge Line Style: Choose from by value/entity property.
-
By value, the same line style is applied to all edges in the Link population, with a default of solid line. This helps you achieve personalized settings for the population.
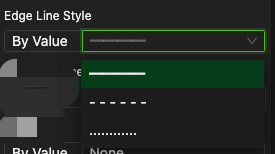
-
By entity property, the system uses the
LineTypeproperty value for each Link. IfNone, the default line style is solid. This helps you achieve personalized settings for individuals.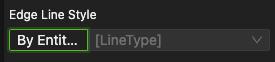
-
-
Edge Curvature: Choose from by value/entity property.
-
By value, the same curvature is applied to all edges in the Link population, with a range of [0,1]. This helps you achieve personalized settings for the population.
-
By entity property, the system uses the
Weightproperty value to set the curvature for each edge. You can also specify other properties for customization. The system automatically adjusts property values to the permissible range, setting values less than 0 to 0, values greater than 1 to 1, andNoneto the default curvature of 0. This helps you achieve personalized settings for individuals.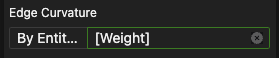
-
-
Arrow: Choose from by value/entity property.
-
By value, all edges in the Link population can be set to None/One Way/Two Way arrows, with the default being None. This helps you achieve personalized settings for the population.
-
By entity property, the system uses the Link's
Directivityproperty to determine whether the edges have One-Way or Two-Way arrows. This helps you achieve personalized settings for the population.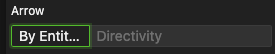
-
-
Arrow size: Adjust using the control slider.
Style Settings
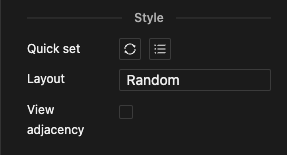
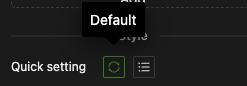
Quick Setting
By clicking a button, you can set all node and edge styles to either the default or according to the entity property.
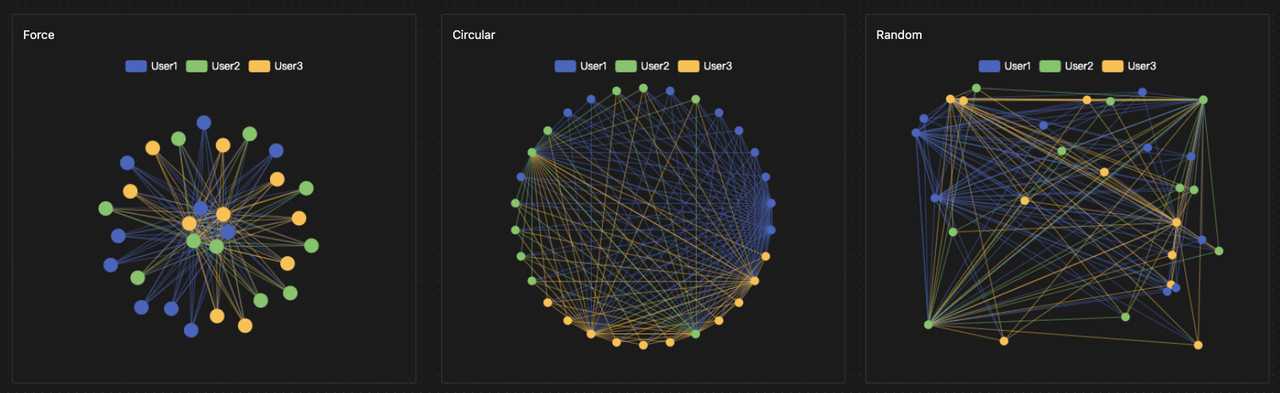
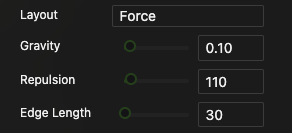
Layout
You do not need to manually set the layout style in most cases, as the system defaults to a force-directed layout. However, you can customize the visual style if specific personalization is required.
-
Options include force, circular, and random layouts. For the same network structure, different layouts will display different visual effects as shown.
-
When choosing circular or random layouts, no additional settings are required.
-
When selecting the force layout, you can adjust gravity, repulsion, and edge length to shape its appearance.
- The styles of nodes, edges, and the layout only affect the visual presentation of the chart and do not impact the network's logical structure.
- The specified entities for nodes and edges determine the scope of the network's logical structure as presented in the chart.
- In summary, the network chart itself does not alter the actual network logic. Even if the chart is deleted, the network relationships expressed in the model will still exist.
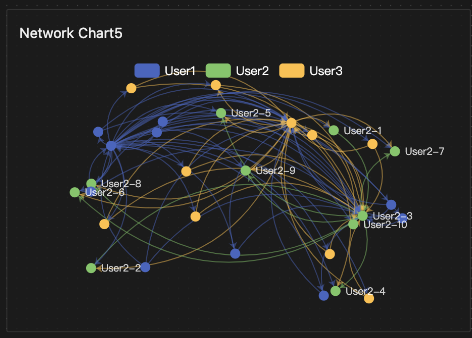
Example
Consider three Agent populations, User1, User2, and User3; two Link populations, Link1 and Link2. You can run this simulation to see how they connect and visually present the network in different styles.