Charts and Controllers
Function
Charts and controllers are primarily designed for user-friendly interaction. They do not directly influence the fundamental logic of your model.
- Charts are used for real-time display of simulation results and scenarios.
- Controllers are used to adjust the values of data objects dynamically.
- Text enables users to provide important information and context via notes.
- Annotation lines serve to draw indicative lines.
Basic Concepts
Interaction Objects
- The drawing objects of the basic chart and statistical chart and the setting objects of the controller are all data component objects.
- The WorldView chart presents the physical scene of space and entity appearance, the Network view presents the network structure, but essentially they all depend on entity properties.
Unrelated to Modeling Logic
- Adding charts, controllers, texts, or annotation lines to the model will not affect its logic.
- Charts and controllers can be flexibly positioned on any canvas within the model.
Validity of Drawing Data
Data objects might update their state multiple times within a single Tick, and the state at the end of the Tick is the valid data for graphical representation. If you need to view intermediate state values, breakpoints and call stack can be used.
Tips on How to Use Temporary Variables
- Due to the creation and destruction of temporary variables in the local process with the trigger, they cannot be displayed in the chart as usual.
- However, if you need to view these temporary variables, you can use debug breakpoints and access the Console's breakpoint call stack information, local variable information, and variable monitors.
How to Use Charts or Controllers in Your Model
Creating a Chart or Controller
There are two methods for creating a chart or controller:
-
Method 1: Drag out the related components and set up the properties panel, such as the data resource.
-
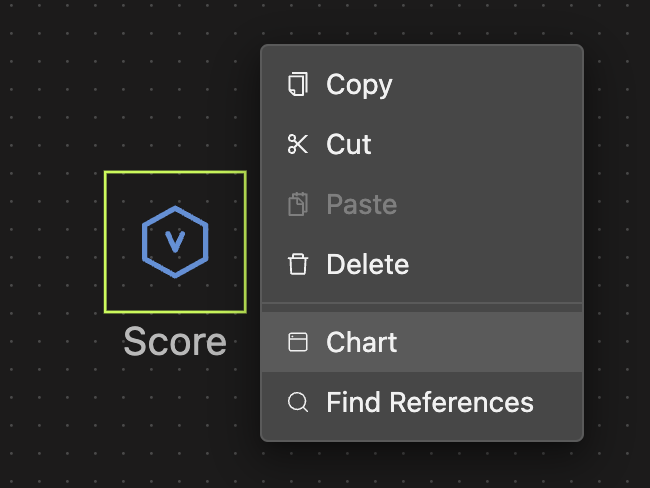
Method 2: Right-click on the target data to call the menu and select the Chart option for a quick start.
Useful Tips
- Supports copying, cutting, pasting, deleting, and renaming.
- Supports resizing by dragging the outline.